


Catch Up on Our Latest Updates
-
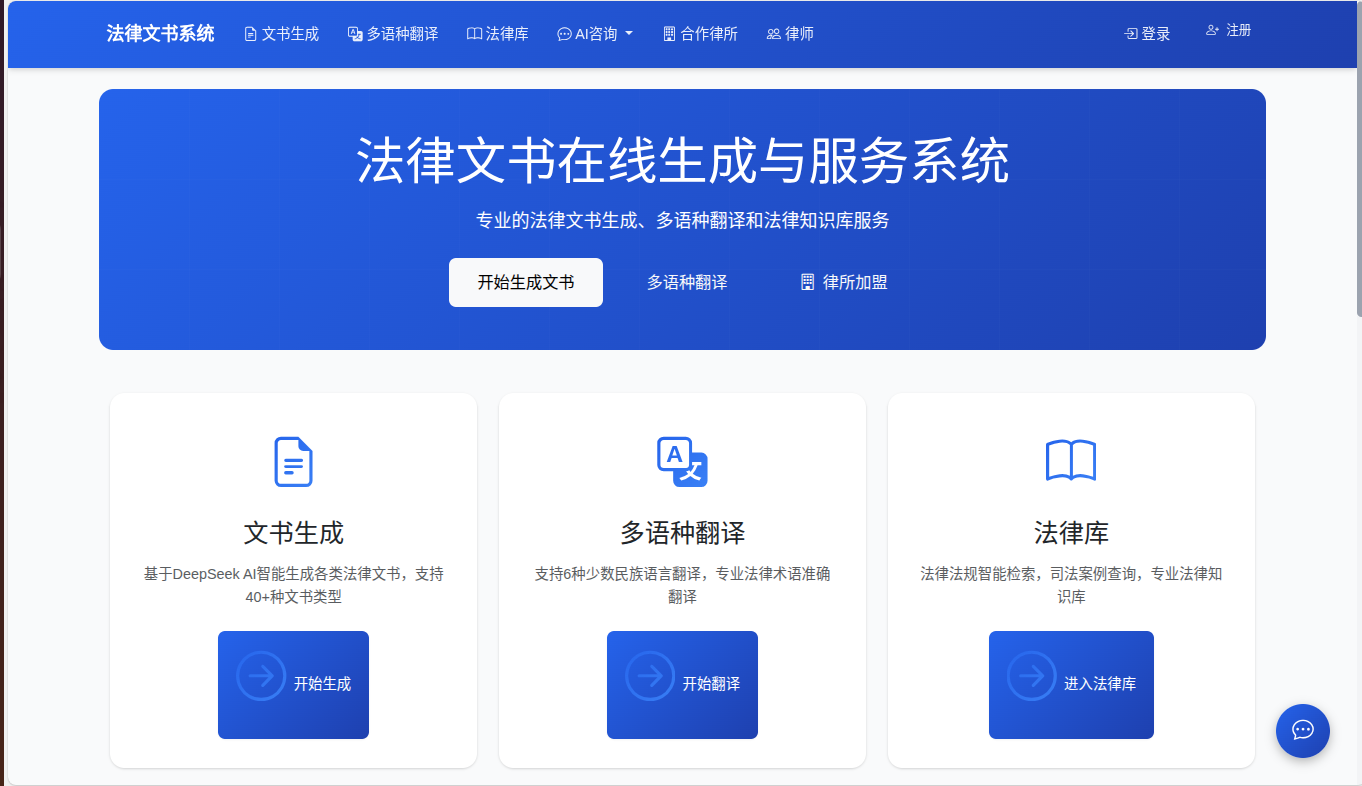
法律文书在线生成与服务系统 Online generation and service system of legal documents
网址:12348fz.Com law.silubaba.com.cn 法律文书在线生成与服务系统功能介绍
-
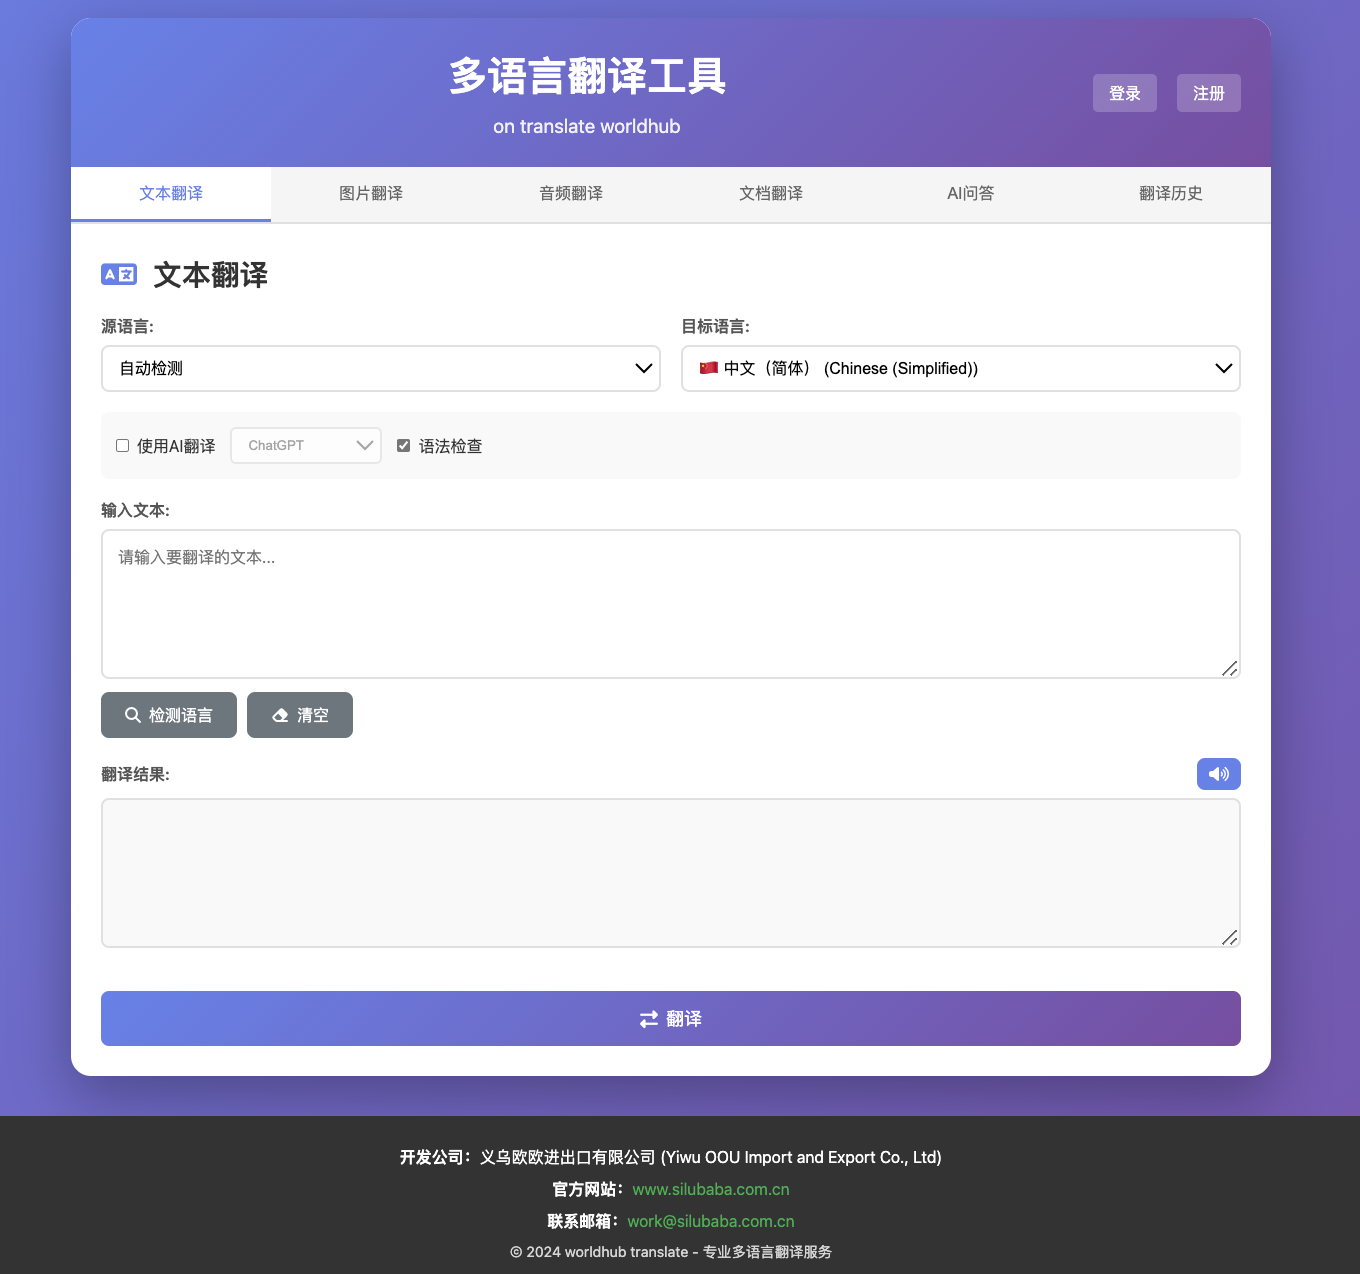
多语言智能翻译 Web 工具 – 功能详细介绍
在全球化商务沟通、跨境贸易协作与跨文化交流日益频繁的场景下,一款功能全面、高效精准的多语言翻译工具成为必备生产力助手。本款多语言智能翻译 Web 版本,整合 AI 技术与多元翻译场景,覆盖 108 + 种语言,从文本、图片到文档、音频全维度满足翻译需求,同时融入 AI 问答、历史管理等实用功能,为个人用户、企业团队及跨境业务从业者提供一站式翻译解决方案。
-
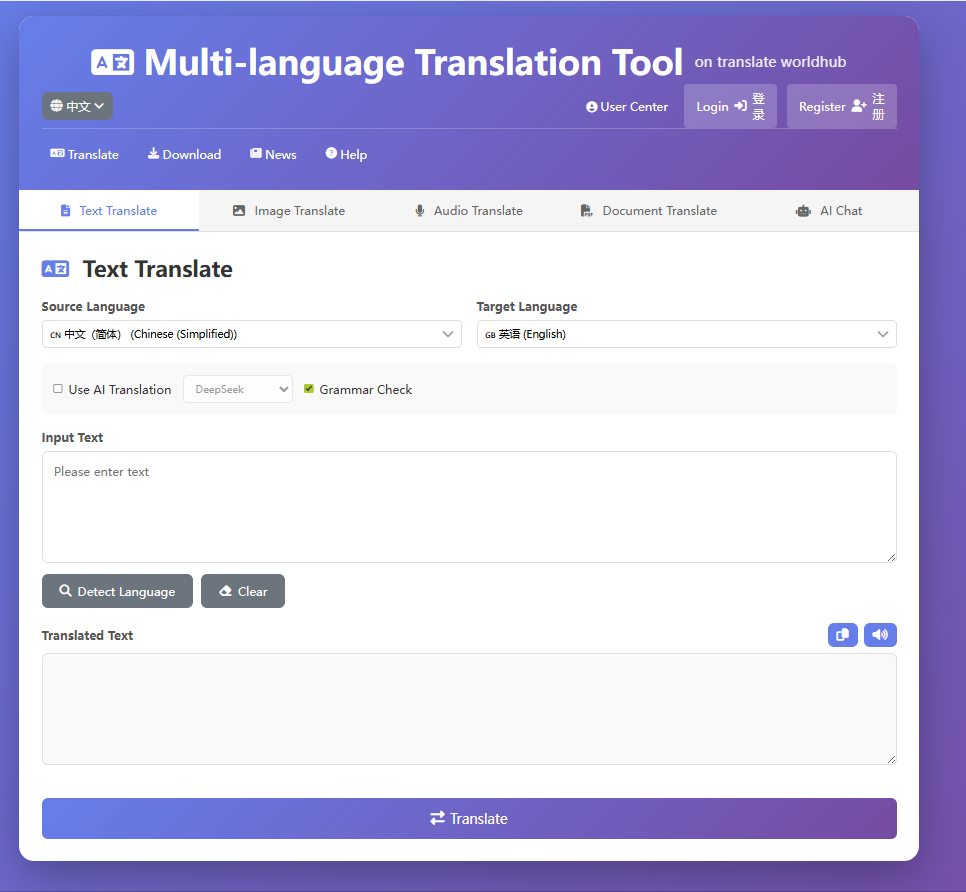
WorldHub Multi-Language Translation Platform
Complete Translation Solution – Web, Desktop, Mobile, Office & Browser Platform…
-
Detailed Introduction to Multi-Entity Full-Process Inventory Management Solution
Detailed Introduction to Multi-Entity Full-Process Inventory Management Solution In today’s era…
-
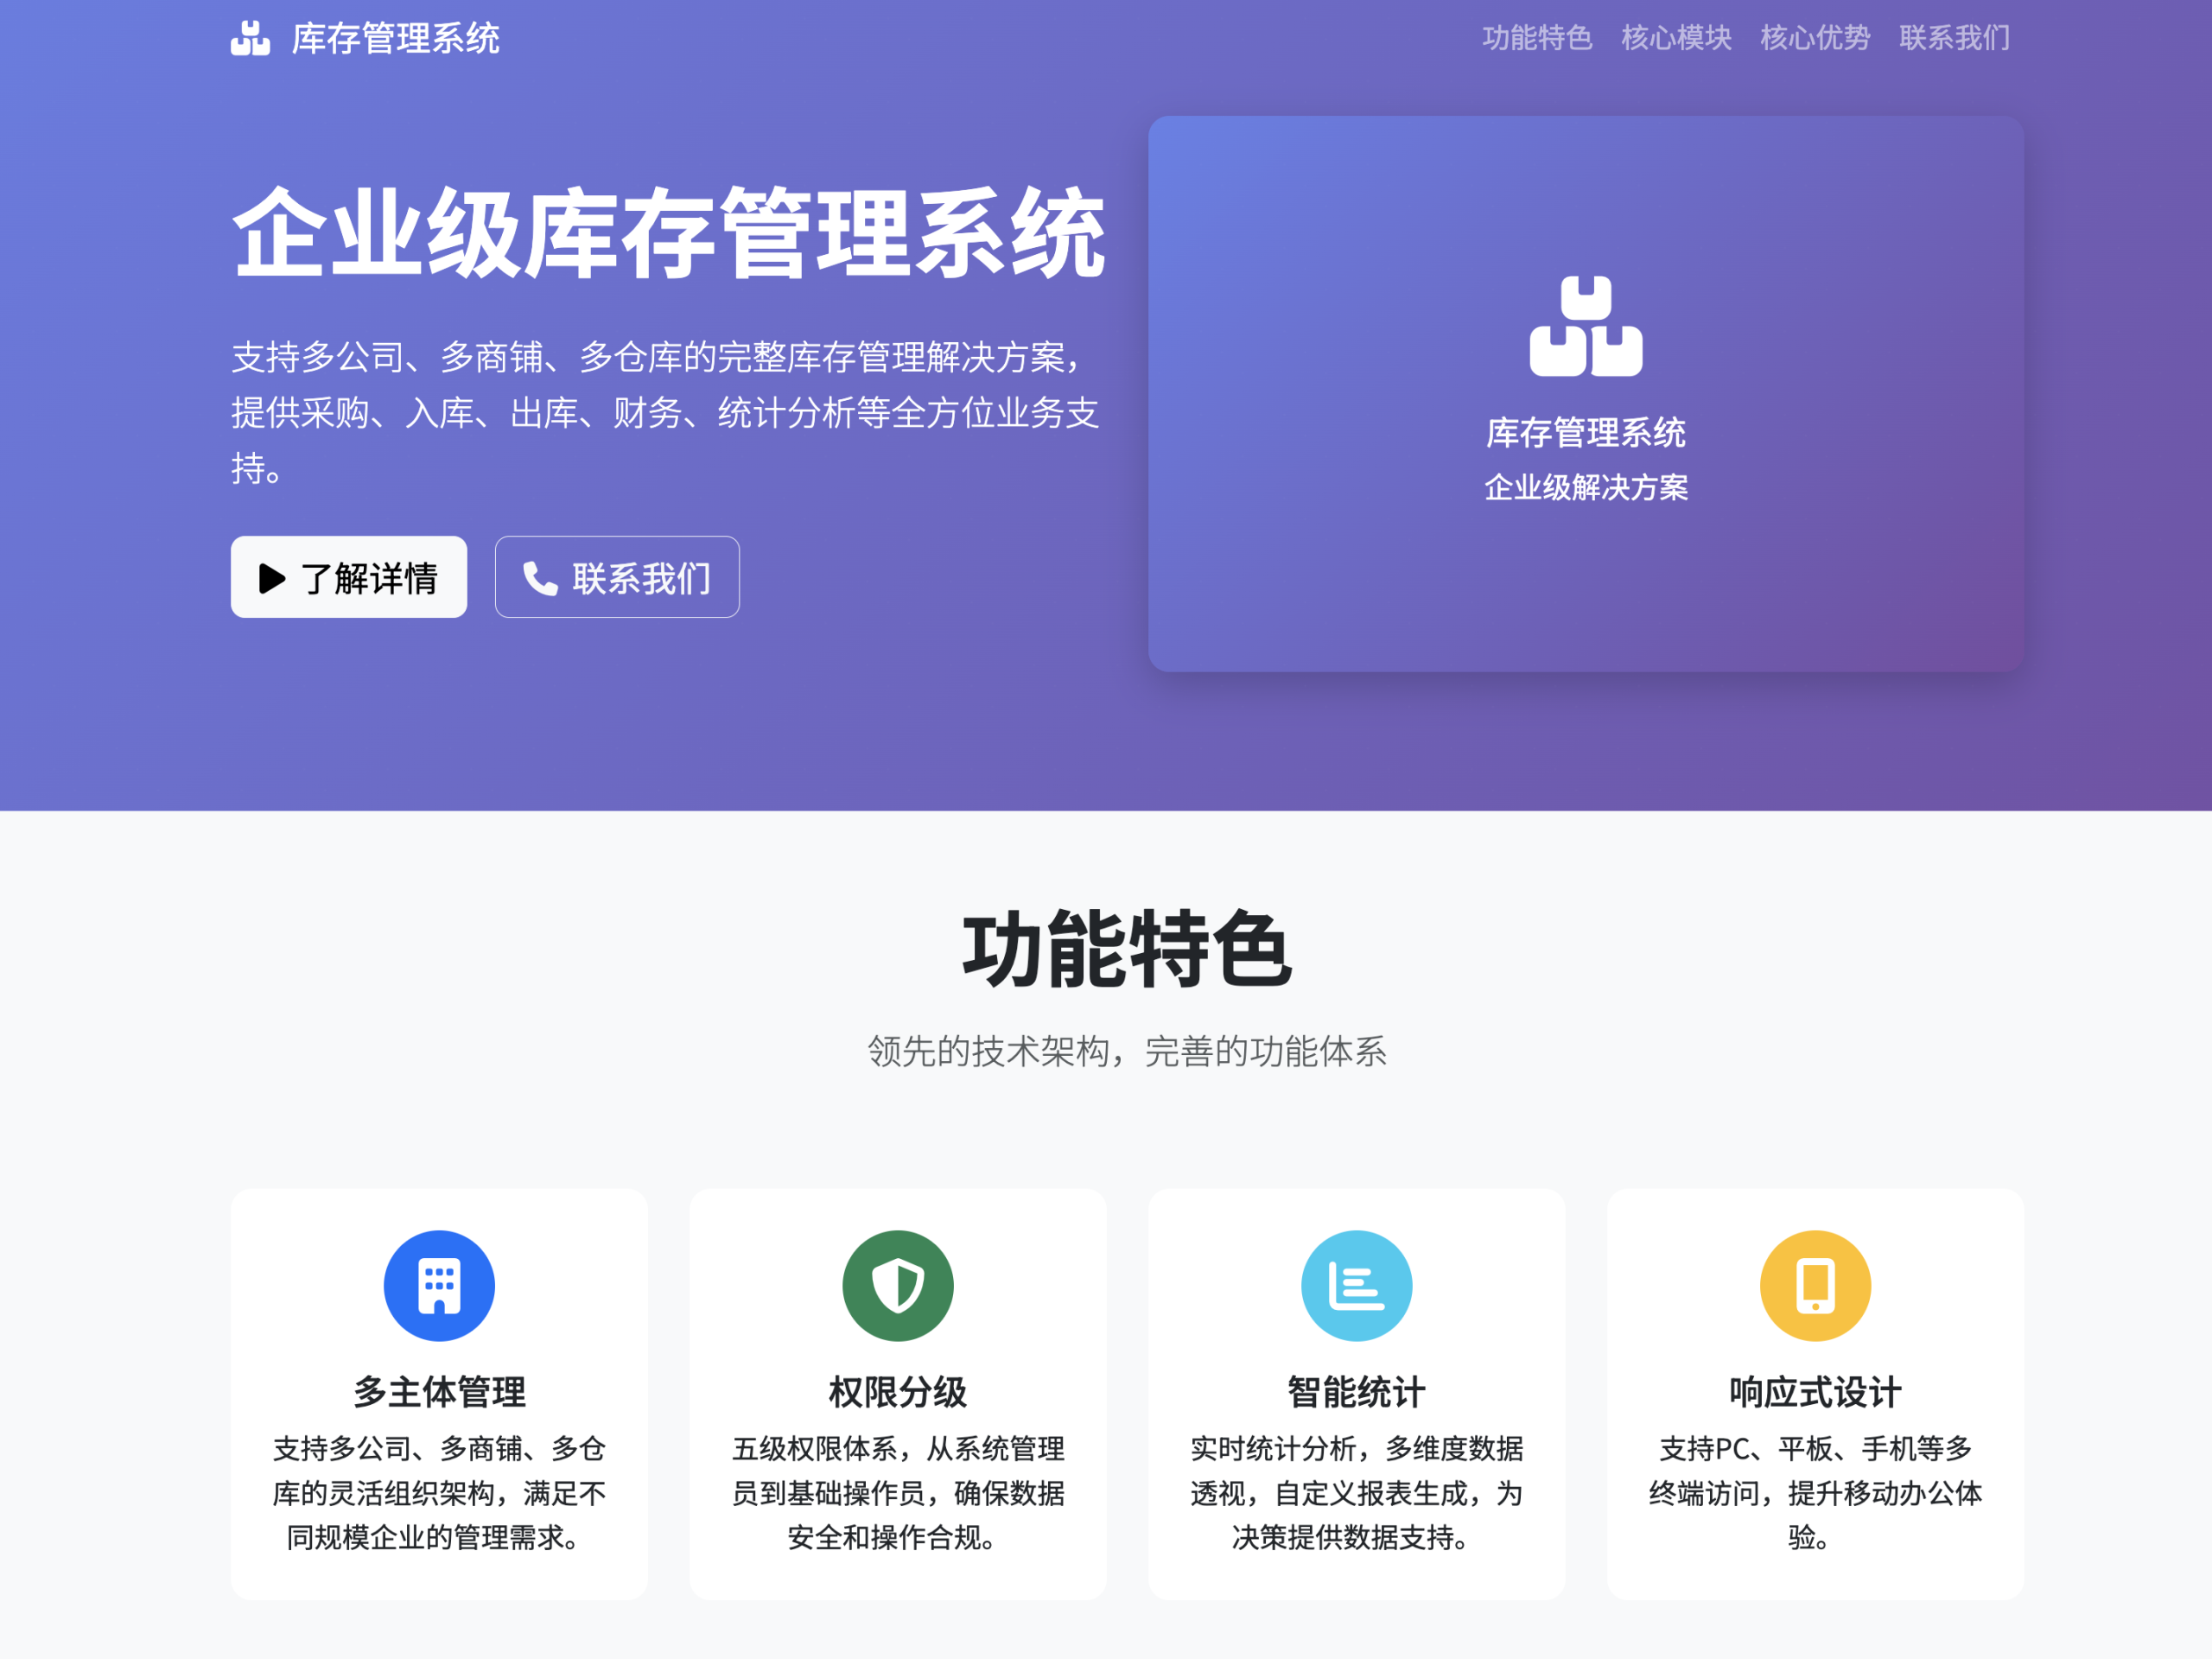
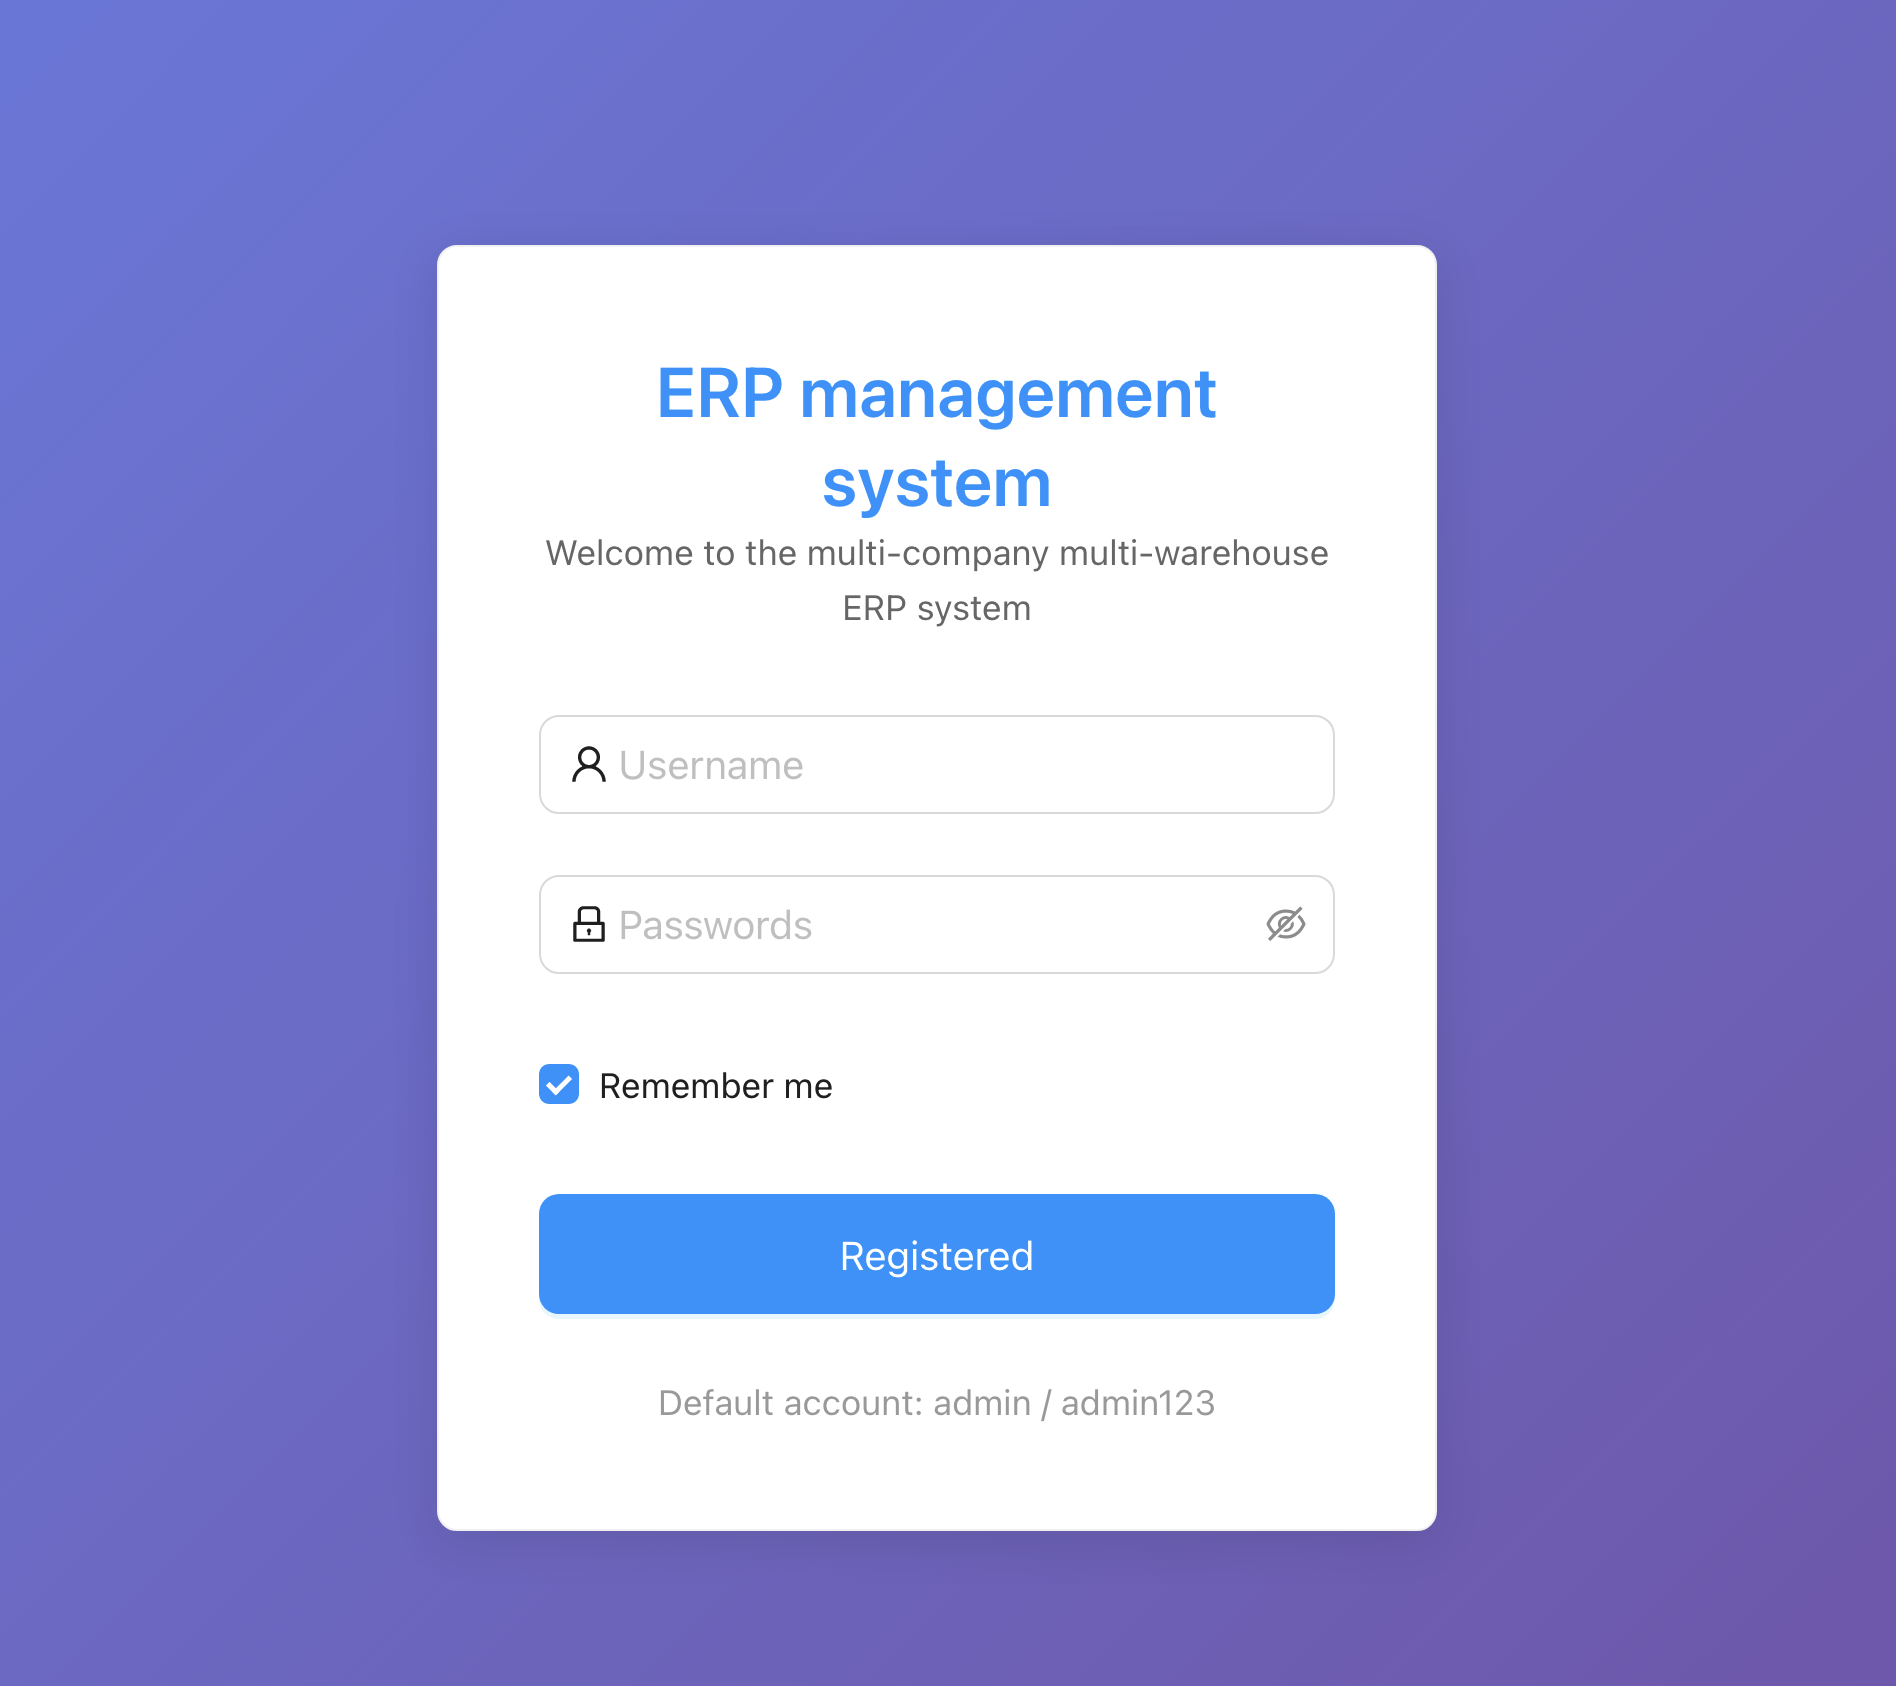
企业级库存管理系统 支持多公司、多商铺、多仓库的完整库存管理解决方案, 提供采购、入库、出库、财务、统计分析等全方位业务支持。
多主体全流程库存管理解决方案详细介绍 在当今信息化高速发展的时代,企业规模化、多元化发展趋势明显,多公司、多商铺、多仓库协同运营已成为常态,但同时也面临着库存混乱、流程脱节、数据滞后、权限失控等管理痛点——传统库存管理模式难以兼顾多主体协同需求,易出现库存串货、成本核算不清、跨部门数据割裂等问题,严重影响企业运营效率与决策科学性。本多主体全流程库存管理解决方案,以“数字化、协同化、智能化”为核心,覆盖多公司、多商铺、多仓库全场景,整合采购、入库、出库、财务、统计分析等全业务链条,为不同规模、不同业态的企业提供全方位、一体化的库存管理支撑,助力企业打破管理壁垒、降本增效、规避风险,实现库存精细化管控与可持续发展。
-
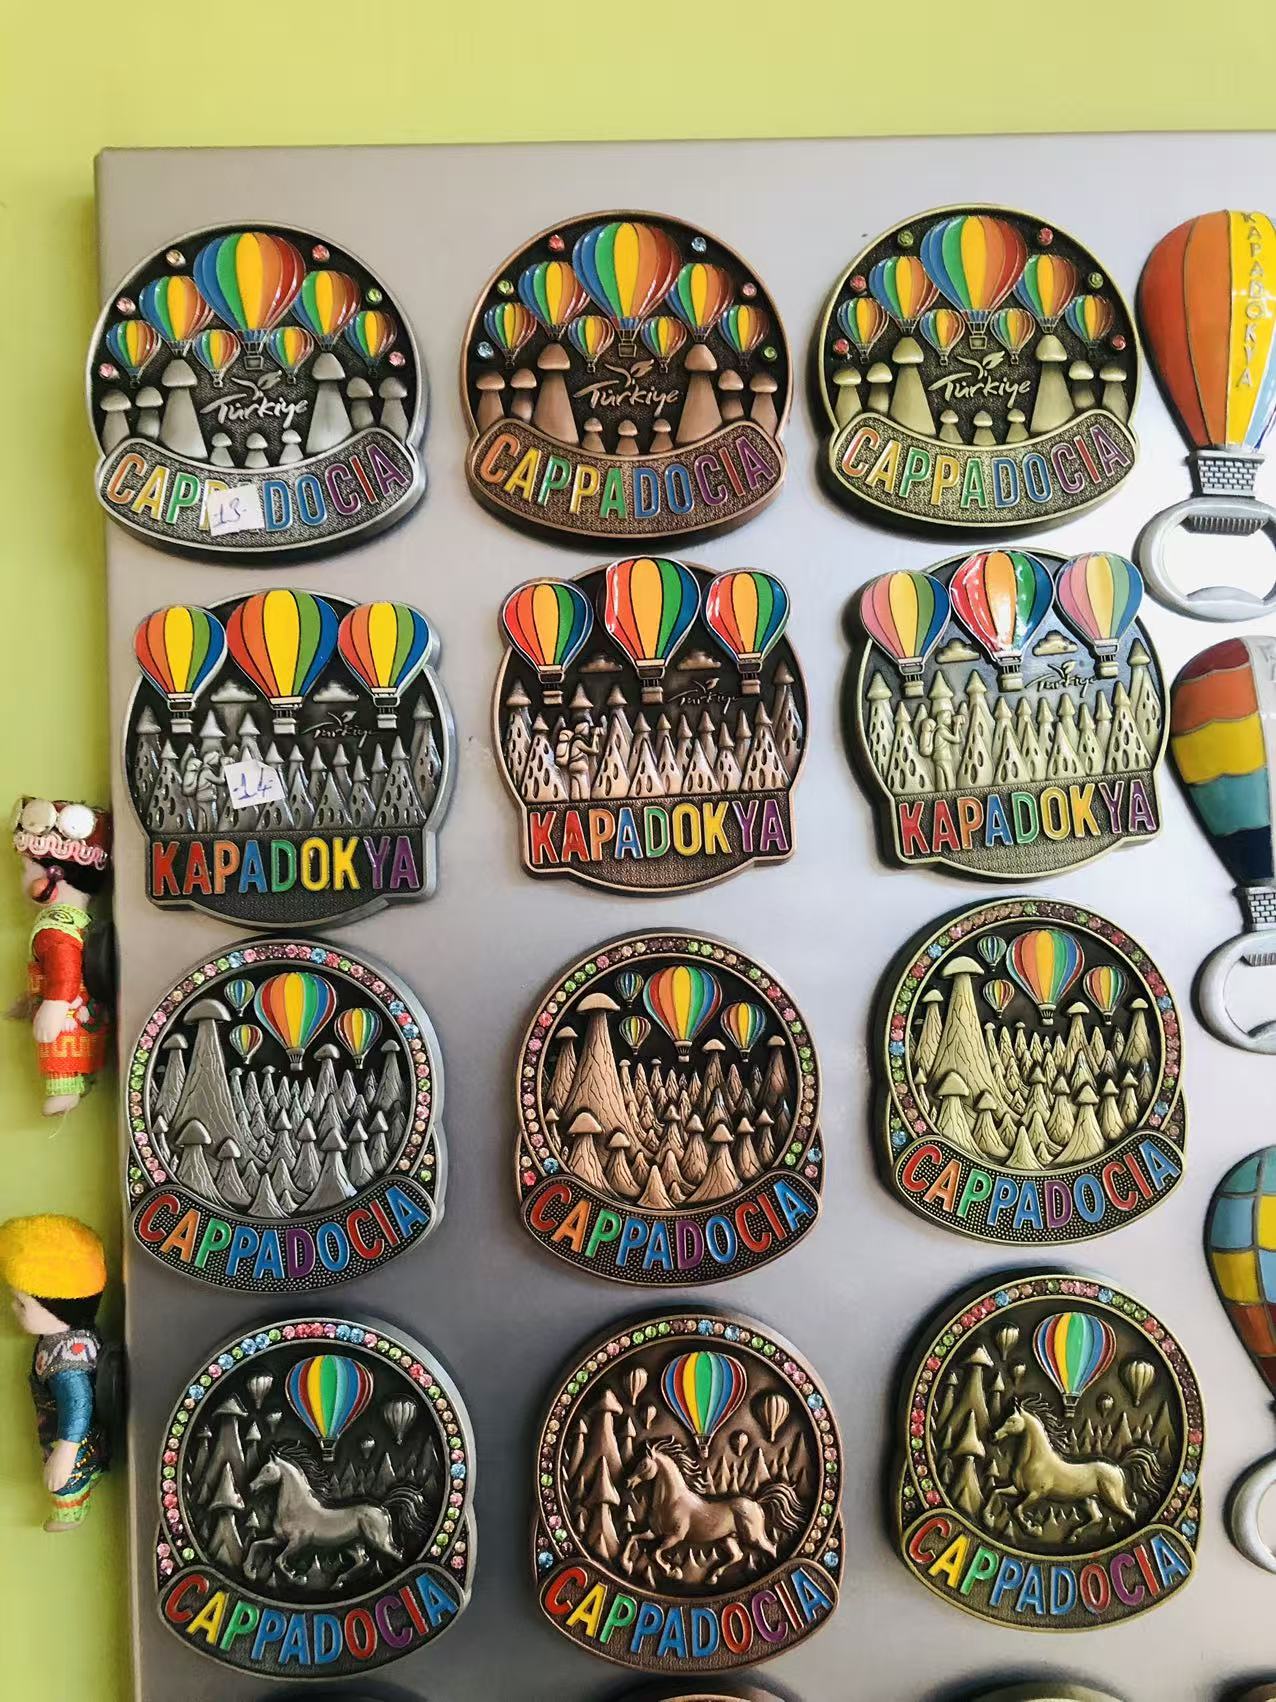
深耕土耳其纪念品市场,以义乌供应链撬动跨境订单增长-Deepening the Turkish Souvenir Market and Driving Cross-Border Order Growth with Yiwu’s Supply Chain
我是奥斯曼托合荪,2024 年下半年,我聚焦土耳其纪念品跨境贸易赛道,凭借对土耳其本土消费市场的精准洞察,成功对接土耳其客户艾合买提·依力马孜,拿下多批高数量纪念品订单,依托义乌成熟的小商品供应链体系,完成从订单对接、供应商筛选、样品定制到批量生产的全流程落地,不仅实现了订单的高效交付,更与土耳其客户建立起深度的合作信任,为后续市场拓展奠定了坚实基础。 I’m mr Aosiman Tuohesun ,In the second half of…